The Best Flow Rates (cfs) for Fly Fishing
Feb. 6th, 2022
Understanding the best flow rates for fly fishing is a vital piece of information that you need in your quiver, and I’m here to explain it to you. Don’t worry, it’s not complicated. In fact, it’s actually fun.
Your success on the water will hinge greatly on whether or not you can read streamflows and understand how they affect the trout you’re pursuing.
I’ve spent countless hours fly fishing and am a nerd when it comes to checking river flows (cfs). I’ll teach you what I’ve learned over the years, and you’ll be a better fly angler for it.
What is a river’s CFS rate?
CFS stands for Cubic Feet per Second and is a rate of water velocity attributed to rivers and streams. It is sometimes referred to as discharge. Snowmelt, rain, drought, and dam releases can all contribute to fluctuations in a river or stream’s CFS rate.
One cubic foot of water is the amount of water that would fit into a 12″ x 12″ x 12″ cube, similar to the size of a basketball. This cube would then contain 7.48 gallons of water. So, one cubic foot per second (CFS) is 7.48 gallons of water flowing past a given point in one second.
CFS is undoubtedly the most commonly used river flow metric consumed by fly fishing enthusiasts, but it’s not the only one. There’s also something called “gage height.”
Gage height, also known as “stage,” is the height (in feet) of the river water above a particular reference point. Since rivers get wider and narrower as they meander, it’s important to note that a gage height reading is based solely on the elevation of the water at the gauging station location–not the entire length of the river.
I’ve actually never heard a fly angler reference gage height, but it’s a useful thing to understand.
There’s a less complicated type of gage height, it’s called a gage staff. Picture in your mind a staff that looks like a measuring ruler stuck into the bottom of the river. That’s a gage staff, and it gives you an idea of how relatively high (or low) the water is at that spot.
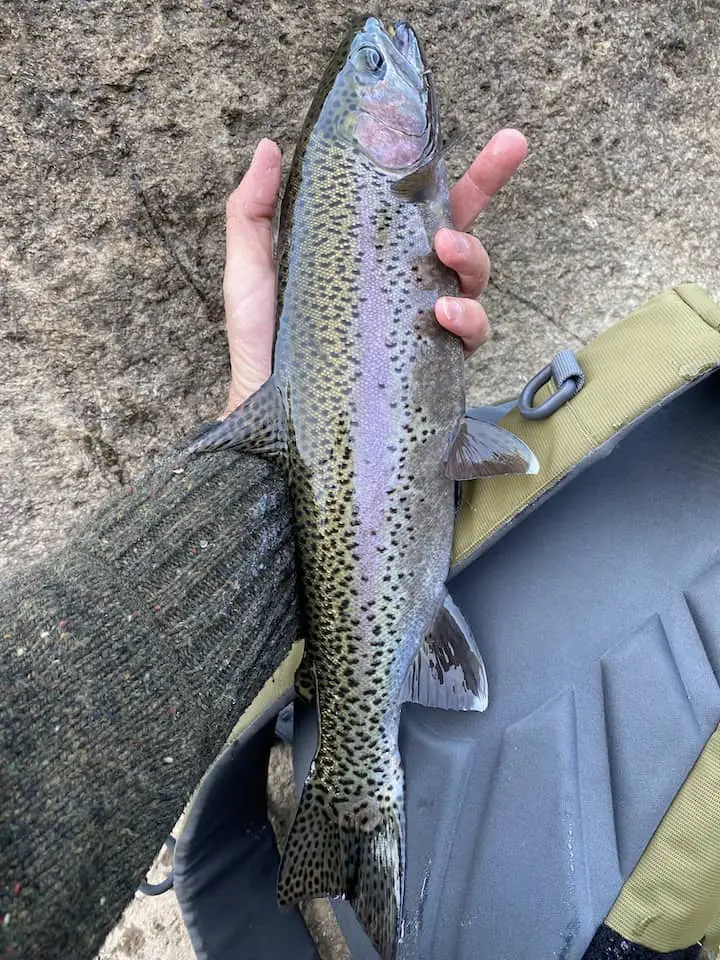
I caught the below rainbow trout (Oncorhynchus mykiss) on a size 20 dry fly in December on a medium-sized river running at 260cfs. I had checked the river flows (cfs) before I drove to the river, and I knew that 260 would fish well in this area.
Where can I find CFS flows for my river?
Fortunately, the USGS (United States Geological Survey) provides cubic feet per second (CFS) flow rates for over 13,500 rivers across the nation. In fact, they often have several discharge meters on the same river.
You can check your local river flows on the USGS National Water Dashboard. Just click on your area within their interactive map and drill-down from there.
Once you hover over a dot on the map, it’ll show real-time river flows, whether it’s high or low from a historical standpoint, and whether it’s currently rising or falling. You can click the dot and it’ll open up a window showing a graph of the flows. Now, click the link that says, “Site Page.”
This brings you to the detailed page for the river you’re researching.
If you prefer, you can just do a google search for the river. Specifically, if I wanted flows for the Bighorn river in Montana, I’d type, “usgs bighorn river flows” and click on the appropriate search result.
Bookmark the pages you’ll check regularly. I usually look at the flows of all my favorite local rivers each morning, just because I like knowing. It gets me thinking and strategizing.
Here’s an example of a USGS graph showing a river’s cubic feet per second (CFS), in this case, a location on the Madison river in Montana.
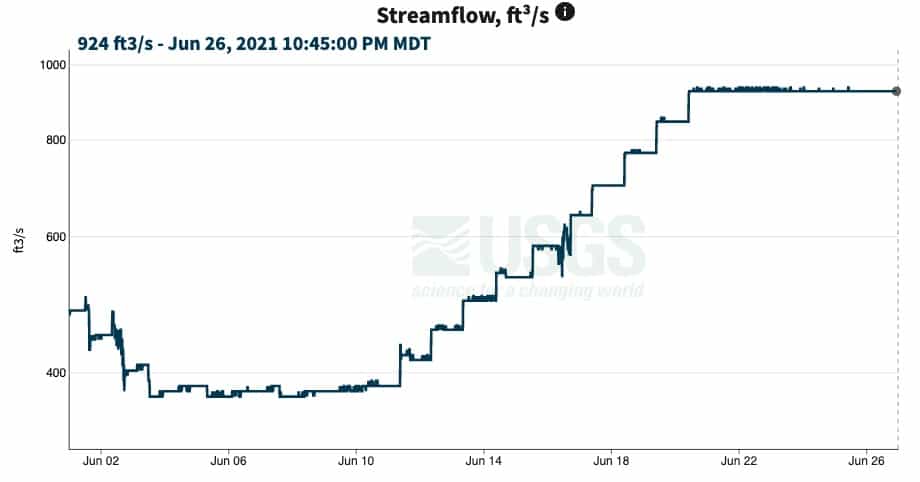
In the above graph, you can see the river’s cfs flows for the past month have risen from a low of around 380cfs to over 900cfs. This discharge increase of around 240% will change the river’s features, and will affect your fly fishing strategy.
For example, if you fished the Madison river on June 6th, and then went back to the river two weeks later thinking you could use the same tactics, you may be very disappointed.
You also have the capability to change the graphed time period. You can look at a week’s worth of data, a month, or even a year. The graphs can usually show the median flows based upon historical data as well, which often goes back to at least 1986.
Once in a while you can also graph water temperature on the same cfs flows webpage–I’m not exactly sure why it’s available for some rivers and not others, but it’s extremely valuable information for obvious reasons (trout behavior).
Keep in mind where on the river the flows are being monitored. Sometimes the flow gauge will be miles away from where you’ll be fishing, upstream or downstream. A single river can have quite a few monitoring stations, so keep that in mind.
Occasionally you’ll get a blank graph with the words “ice affected” clearly displayed. This, of course, means the flow gauge is being adversely affected by ice accumulation.
It’s easy to sign up for water alerts from the USGS. You can set options for what will trigger a notification being e-mailed to your inbox.
What are ideal flows for fly fishing?
Some anglers ask, “What are the best fishing flows for my river?” But, that’s tantamount to asking, “How much is a house?” The answer, of course, is that it depends.
The truth is, every river is different. 200cfs might be a deluge on one river, but a trickle on another. You need to learn what your local rivers look like at different flows. It’s easy, just start checking the flows before you head to the river. You’ll quickly get a feel for it.
Some tailwaters have regular release schedules that directly influence the flows (cfs). What’s a tailwater? It’s a section of river situated below a dam.
This is in contrast to a freestone river, which is a river that is solely dependant upon rain, springs, and snowmelt for flows.
Here’s one example of how dam release schedules can directly affect flows within a tailwater.
There’s a tailwater river I fish often that has a preset dam release schedule. In other words, a schedule determining when they deliberately ratchet the flows up-and-down.
On this particular river, they increase flows to give river rafters a better experience. It seems odd, but I’ve verified this with the state. That’s the only reason. They must have some sort of agreement written up with a rafting association or business.
Here’s an example of what this looks like on a USGS river flows graph. This isn’t my river, but the activity pattern looks very similar.
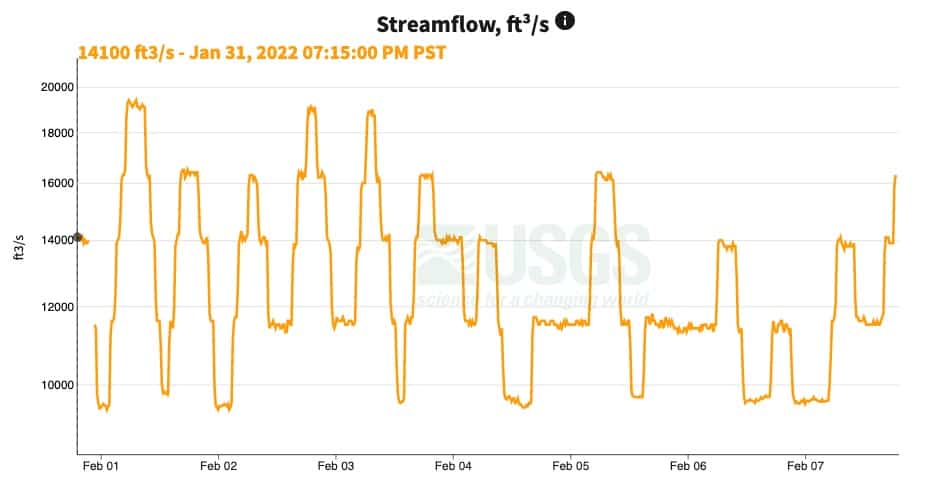
You can see that the flows fluctuate quickly, and this is due to dam releases. If you learn the schedule for your local tailwater, you can avoid frustration and target prime time fly fishing flows.
For example, on the tailwater we’re talking about, 200cfs to 300cfs is my favorite flow level. I avoid 9am to noon, because the flows ramp up to 1,000cfs for the rafters, and on this particular river 1,000cfs is tough to wade and more challenging to fish. Plus, there are times when loud caravans of rafters pass by, potentially putting the trout down.
Here’s a tip I’ve learned from experience.
Let’s say you’ve learned your local tailwater’s release schedule, and you see that flows drop back to “normal” at noon. You shouldn’t necessarily rush to the river by noon. The reason is that it takes time–sometimes hours–for the reduced flows to affect downstream water levels.
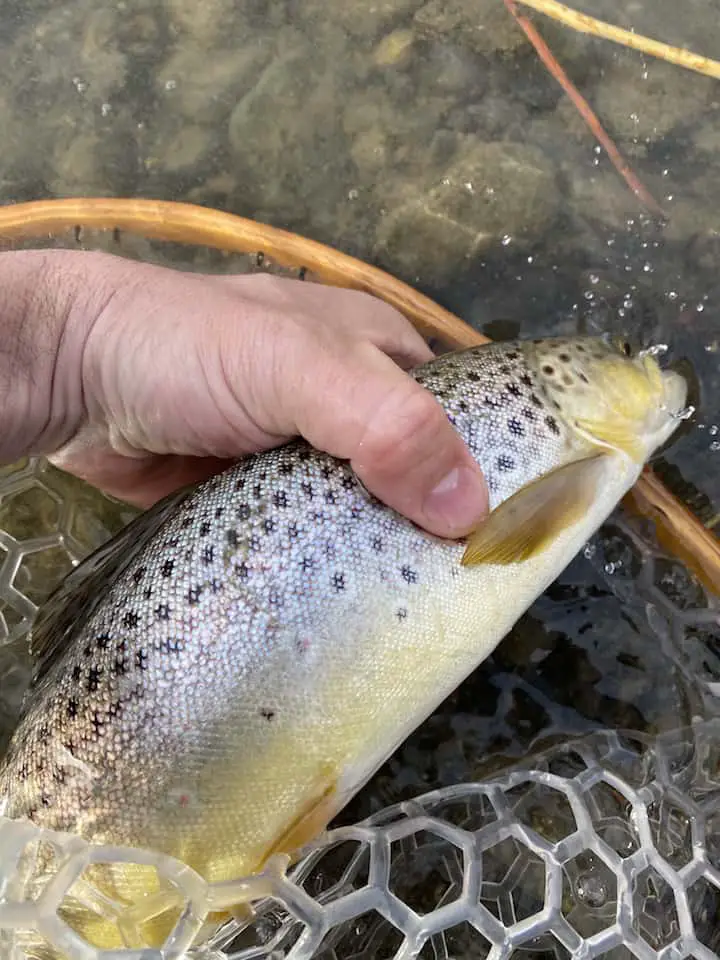
Here’s one of several brown trout (Salmo trutta) I hooked into on a dry fly during flows that were 80% lower than normal. I was targeting a pool during a minor hatch, knowing the trout would likely congregate there.
Going back to the tailwater I fish often, the dam release drops like a rock at noon, but it takes well over an hour for me to see the flows drop less than a mile downriver where I fish. Imagine dropping a flower petal onto the water’s surface at the dam, and consider how long it’ll take to reach the spot you’re fishing.
Let’s get back to the main question about the ideal flows for fishing.
In it’s simplest form, the answer is: stable flows. Fish like stable flows, not fluctuating flows.
Generally speaking, trout are comfortable in flows around 2-3 feet per second in 1-3 feet of water. Put simply, drop a leaf onto the surface of the water and estimate how far it travels in one second.
Here’s what stable flows look like on a USGS graph.
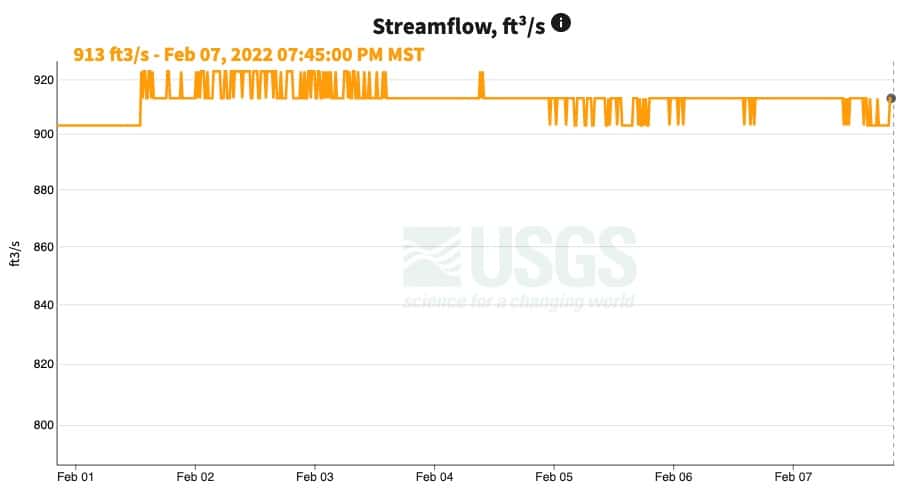
Do you see how flows (cfs) fluctuate between 900 and 920 consistently all week? That’s what I call very stable flows. These flows allow trout to focus on feeding–they don’t have to worry about where to position themselves because the water is rising or falling. It’s their steady-state.
But, you won’t always be able to snap your fingers and get stable flows.
If you have to choose between fishing rising water or falling water, choose rising water. More on this below.
Here’s another tip.
Keep in mind that during winter, the water will usually be warmest closer to the dam, and cooler the farther you get from the dam. The reason is that the water being released from the dam is coming from a resesrvoir which has more stable water temperatures year-round due to its depth.
Conversely, during summer, the water closest to the dam will likely be cooler than the water farther downstream. This is (again) because the reservoir’s water temperature is relatively stable and isn’t as heavily influenced by the season.
Catching trout in high or low flows is a matter of doing some research and preparing. Here’s a video of a brown trout I landed in low winter flows.
How to fish higher flows
While higher flows can occur from a dam release (see above), most anglers are referring to snowmelt runoff that occurs during spring and early summer when they mention “higher flows.”
During higher flows, the current is faster (unless the river has room to spread out), the water temperature drops, and the water is dirtier. Some guides refer to the off-color water as “chocolate milk.”
Trout move closer to the shoreline during rising flows in order to get out of the faster current. On the flip side of the coin, when flows are dropping, trout head for deeper pools.
As the water rises, it usually sweeps insects into the river, which gets the attention of trout.
Streamer fishing is almost always the most productive fly fishing method during high flows. Use big dark-colored fly patterns like woolly buggers in black, brown, purple, or olive.
In the cloudy water, trout make fast decisions on whether to eat something or not, since they can’t see it from a distance, and this works in your favor.
Don’t miss my article on safely wading higher flows. You might think it’ll always be the other person who ends up in the river, but I share a few stories that’ll get your attention.
Summary
As a fly angler, it’s crucial that you understand river flows. It’s this understanding that can make the difference between having a great day on the water, and getting skunked. I don’t know about you, but I despise getting skunked–I take it personally.
Eventually, you’ll be able to check your local river flows online and immediately be abe to visualize what the river looks like, which spots will be most productive or promising, and so on. This is will pay huge dividends over time.
Take the time to learn your local river flow dynamics.
About the Author
My name's Sam and I'm a fly fishing enthusiast just like you. I get out onto the water 80+ times each year, whether it's blazing hot or snow is falling. I enjoy chasing everything from brown trout to snook, and exploring new waters is something I savor. My goal is to discover something new each time I hit the water. Along those lines, I record everything I learn in my fly fishing journal so I can share it with you.
Follow me on Instagram , YouTube, and Facebook to see pictures and videos of my catches and other fishing adventures!
